I had almost forgotten about the experiment I started late last year using the data logger I built to log the temperature and humidity values in my basement lab for an entire year. The logger worked well during the initial trial run, but having it run continuously for a whole year is another story.
Anticipating possible power glitches and prolonged power outages, I equipped the data logger with rechargeable batteries and a trickle charger, which could provide many days of run time should the power go off. This turned out to be quite useful when the storm hit last month and left me without power for a week.
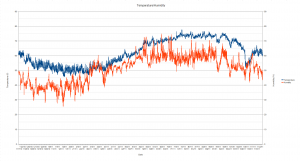
The data file came in at around 80 MBs. Since the logger was set to log an entry every 10 seconds, the log file grew quite big and it contained over 3,000,000 rows of data. I created a simple program to smooth out the data and reduced the data points to around 15,000 for plotting. And the final graph is shown below:

As for the dip in temperature towards the end? Well, you’ve guessed it, that was due to the power outage during the Halloween time when the storm hit.

