Using software defined radio such as the popular RTL-SDR (1, 2) as a spectrum analyzer is nothing new (examples can be found on HackADay and EDN). In this blog post, we will discuss some of the do’s and don’ts when using SDR as a spectrum analyzer and look at some measurements I took using the popular NooElec SDR based on Realtek‘s RTL2832U DVB-T demodulator chip and Rafael Micro‘s R820T tuner chip.
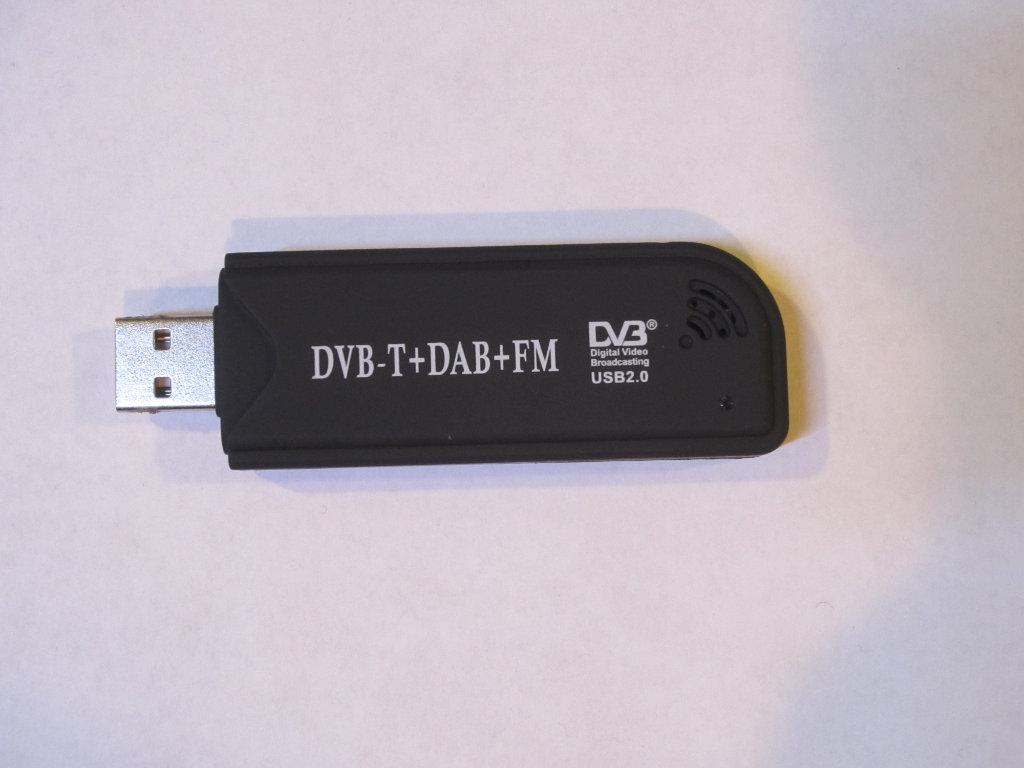
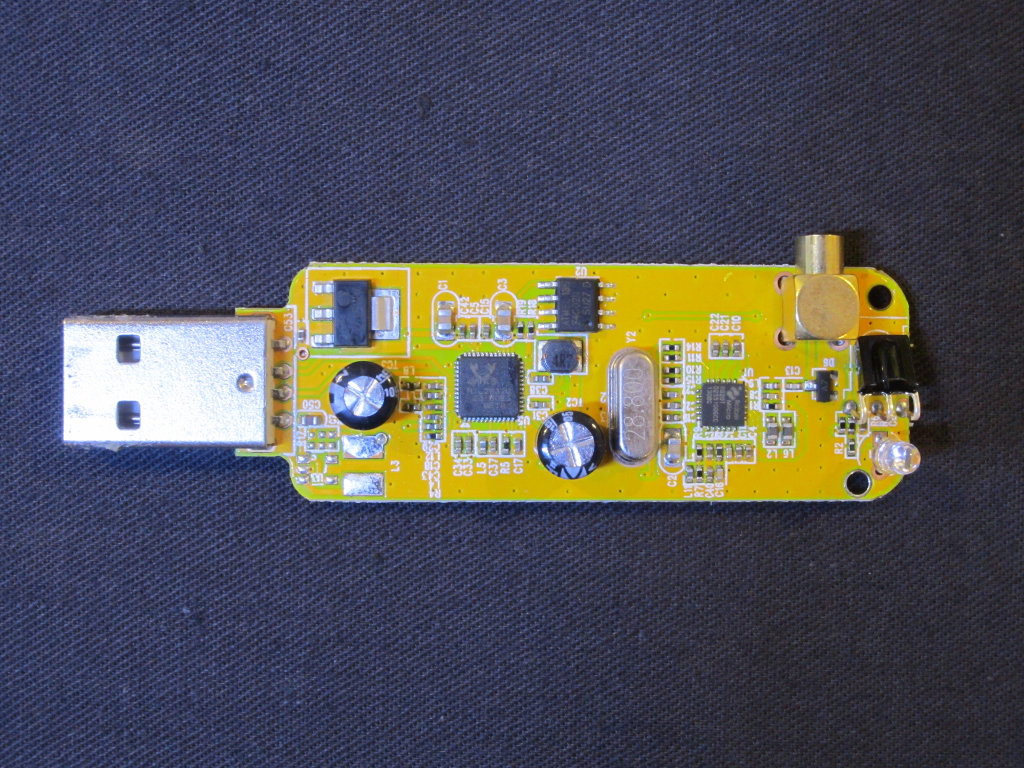
Below on the left is a picture of the SDR receiver dongle and to the right is a teardown picture showing the PCB. The receiver I have was bought from NooElec directly, cost just under $15. There are many similar receivers out on eBay selling for much less, I suspect that spec-wise they are probably more or less the same as they are based on the same chipset.
|
|
While the typical operating frequency range for these SDR’s is specified as 25MHz-1750MHz, the actual performance varies depending on the particular unit as this frequency range is not guaranteed (particularly on the high frequency side) by the chip. The unit I have operates from 25MHz to approximately 1550MHz and beyond which the receiver would sometimes lockup and require a hard reset (e.g. unplug and plug in again) for it to work properly. So my first advice is take the spec with grain of salt and test your SDR’s frequency range first before using it so you will not run into any surprises later.
This particular SDR comes with an MCX connector, which is used to connect to the supplied whip antennae. Since we rarely use aerial reception for spectrum analysis, a pigtail MCX to BNC converter cable is used so that it can be connected to a signal source. Note that the input impedance of the SDR is typically 75Ω, ideally you should use a 75Ω to 50Ω feedthrough termination adapter to ensure proper impedance matching. But since the frequency range of the SDR is not particularly high, the added SWR is low enough and typically not a big concern.
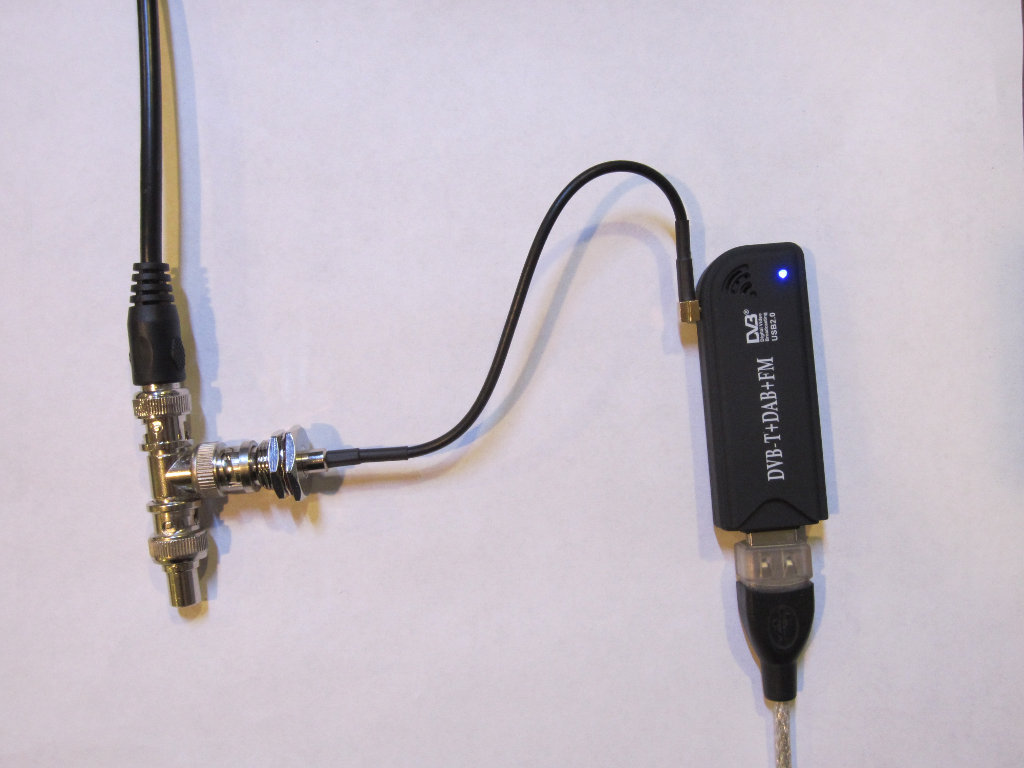
The picture below shows a typical setup. The signal to be analyzed comes in from the the BNC cable on the left and goes through a BNC Tee, one side of the Tee is terminated with a 50Ω load and the other side goes through a BNC-MCX converter and then goes to the SDR. Of course you can always use a feedthrough terminator instead of the Tee. Again, because the frequency range is relatively low, even without proper termination, the signal fluctuation across the measurable spectrum due to reflection is small enough for casual measurements.
There are many open source software packages we can choose from for spectrum analysis. One thing to note though is that many of the “scanner” software actually are not quite suitable for this task. For instance, I tried rtlsdr-scanner and noticed that the measured spectrum is distorted regardless of the FFT length and dwell time settings. A few other scanner packages I tried also exhibit similar issue.
So I turned to some of the more popular SDR radio software packages such as SDR# and Gqrx SDR. SDR# renders the spectrum reasonably well but the signal amplitude reading seems to be off, at least I couldn’t seem to be able to find a way to set the gain correctly to reflect the actual signal strength. Gqrx SDR is the first software suite I found that rendered the spectrum correctly and reported the signal strength in the ballpark. It also has a quite polished user interface and is extremely easy to use.
Perhaps the most useful tool for analyzing spectrum is from OSMOCOM in my opinion. Its software (OSMO SDR and GrOSMO SDR) has some quite serious capabilities and is perfect for spectrum analysis. The rendering and measured signal power are consistent with those from gqrx. I used osmocom_fft for all of my analysis below.
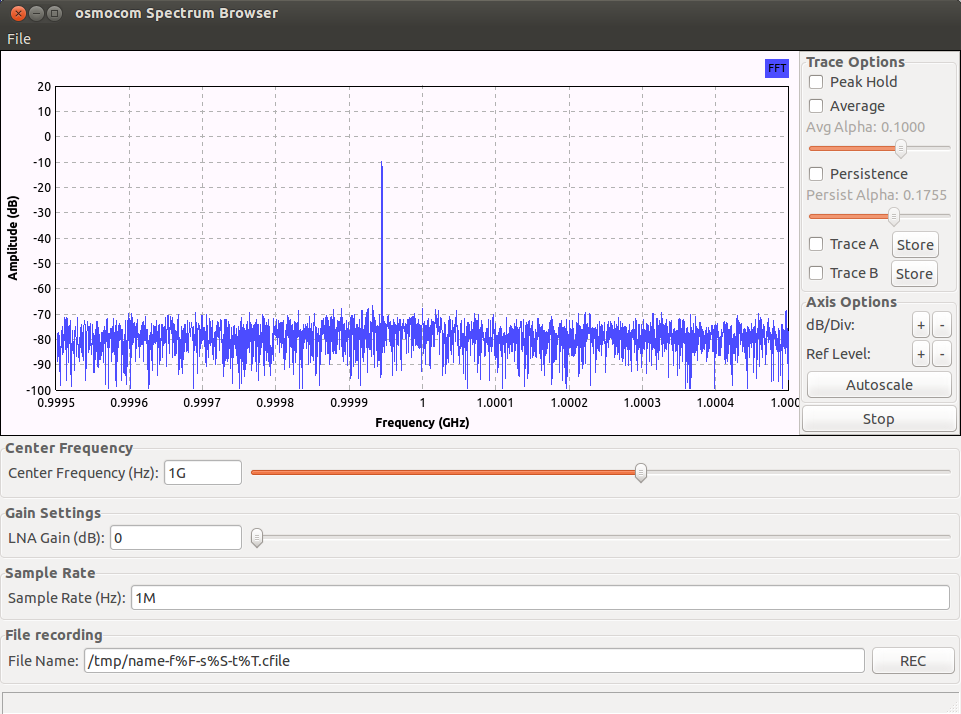
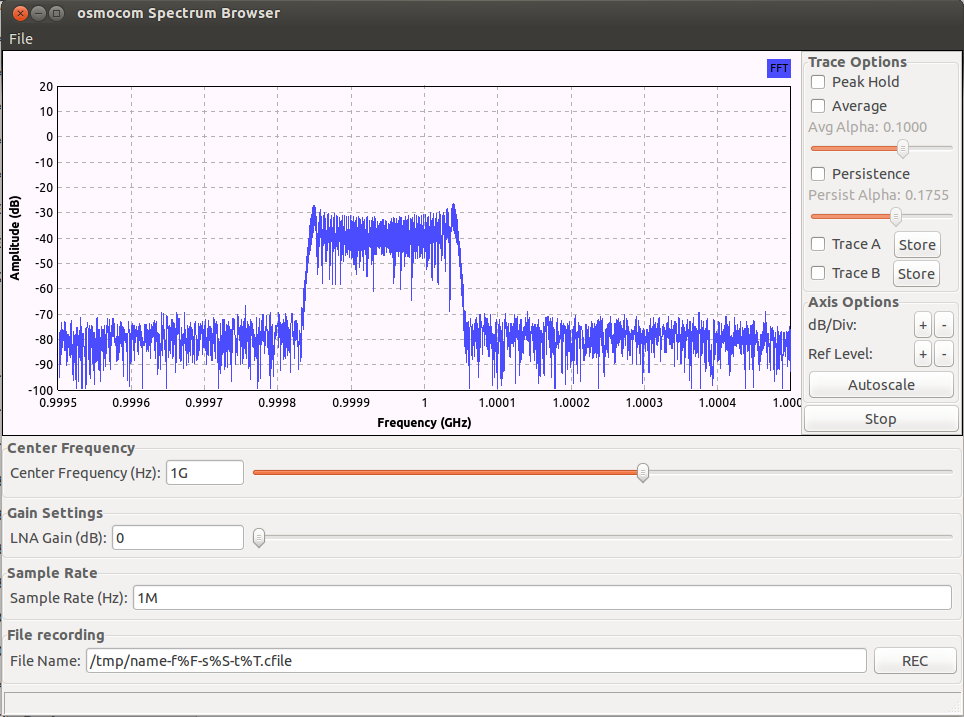
First, let us examine the noise floor of the RTL-SDR. The following screenshot shows the spectrum centered around 1GHz when there is no signal at the input.
osmocom_fft -s 1M -f 1G -g 0 –fft-size=4096 –fft-rate=16
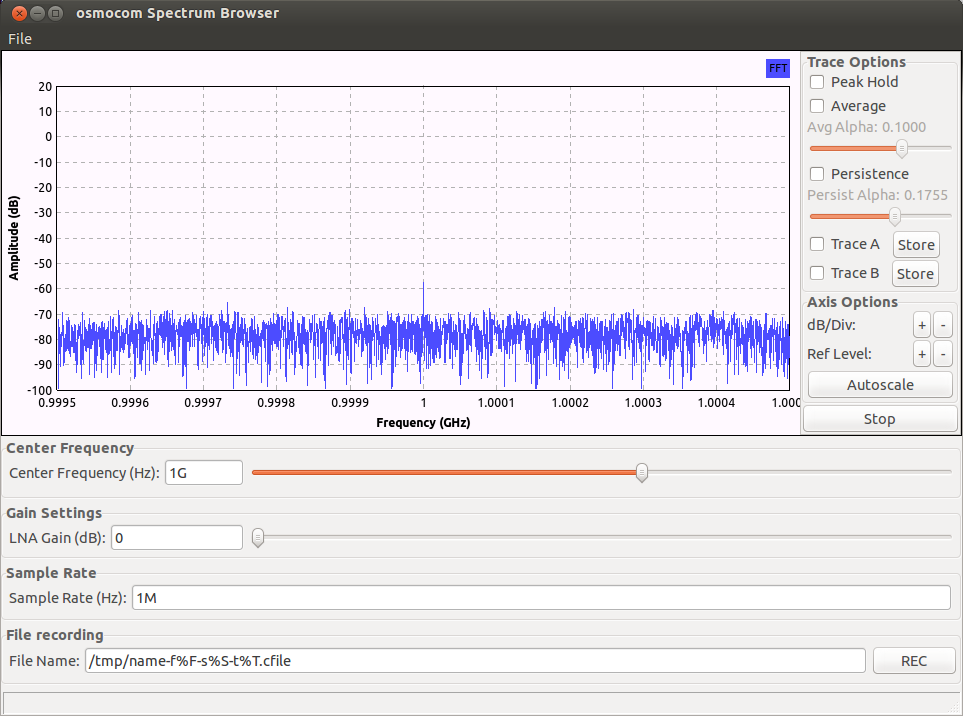
Note that the vertical axis is in dB (amplitude) and not the dBm used in spectrum analyzers! Since we only care about the ratios if we measure a known 0 dBm (on 50Ω) reference signal, we can easily shift the chart and figure out the dBm of our signal power. So I measured a 0 dBm signal and the amplitude ratio happened to be 0 dB (this means we can simply use this figure as our dBm reading).
From the graph we can see that the noise floor is at roughly -70 dBm except for the DC spike in the center (independent of frequency band) which is is at around -57 dBm. Because the SDR does not have an adjustable attenuator, we typically want to set the LNA gain at 0 dB. Any gain higher than a few dB will increase the noise floor and thus reduce the dynamic range of the spectrum analyzer. Also, due to the non-linearity of the LNA, you will see significant number of spurious signals through out the observation frequency band if the LNA gain is set higher than a few dB.
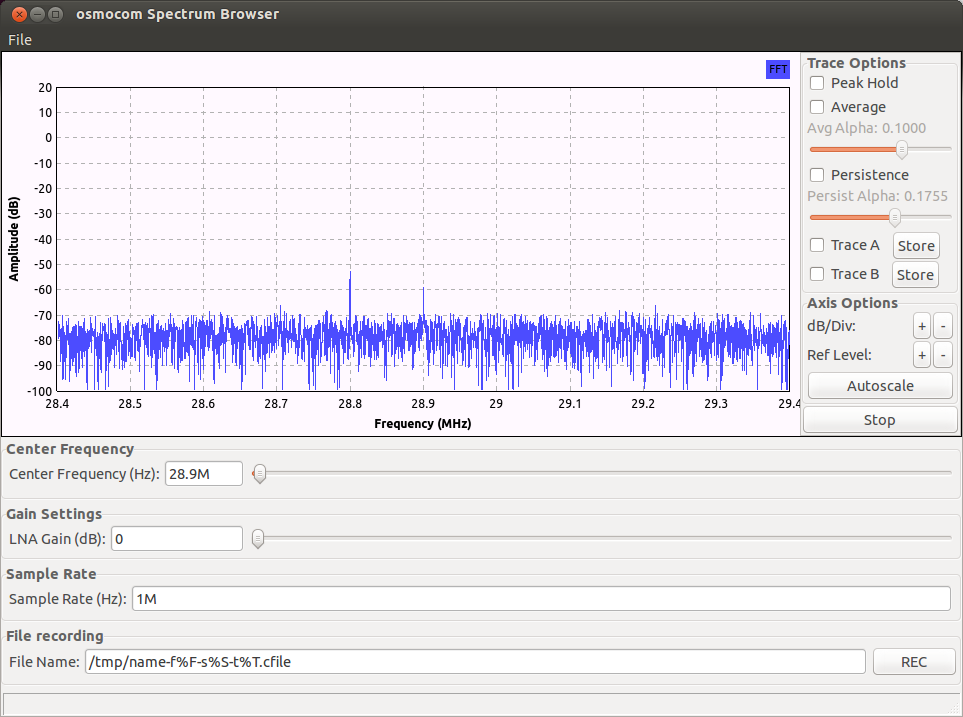
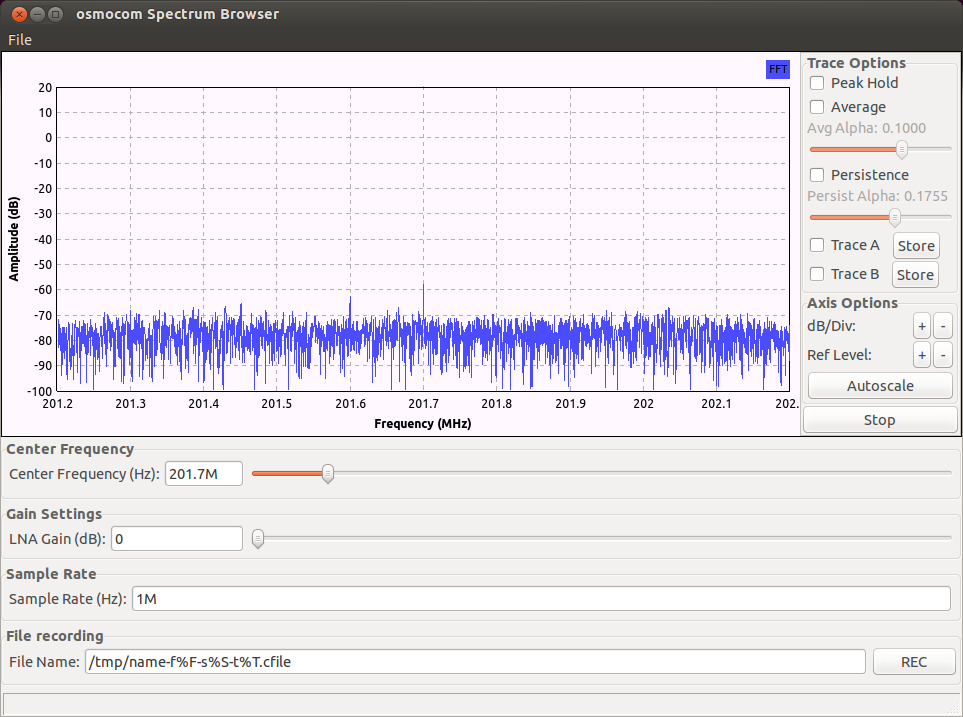
Next, let’s take a look at the LO leakage. The local oscillator of the RTL-SDR operates at 28.8 MHz and its spectrum can be seen in the screenshot to the left below. The LO leakage is quite significant as the board wasn’t specifically designed to minimize LO leakage. The LO leakage can be observed throughout the multiples of the LO frequency, but the amplitude decreases as the frequency goes higher. The power of the 7th harmonics (at 201.6 Mhz, -62 dBm) is low enough to be ignored (see picture to the right below) and any harmonics higher than this will be insignificant and can be ignored. For typical FM radio application, LO leakage is not an issue as the FM band sits between the 3rd (86.4 MHz) and 4th (115.2 MHz) harmonics of the LO.
|
|
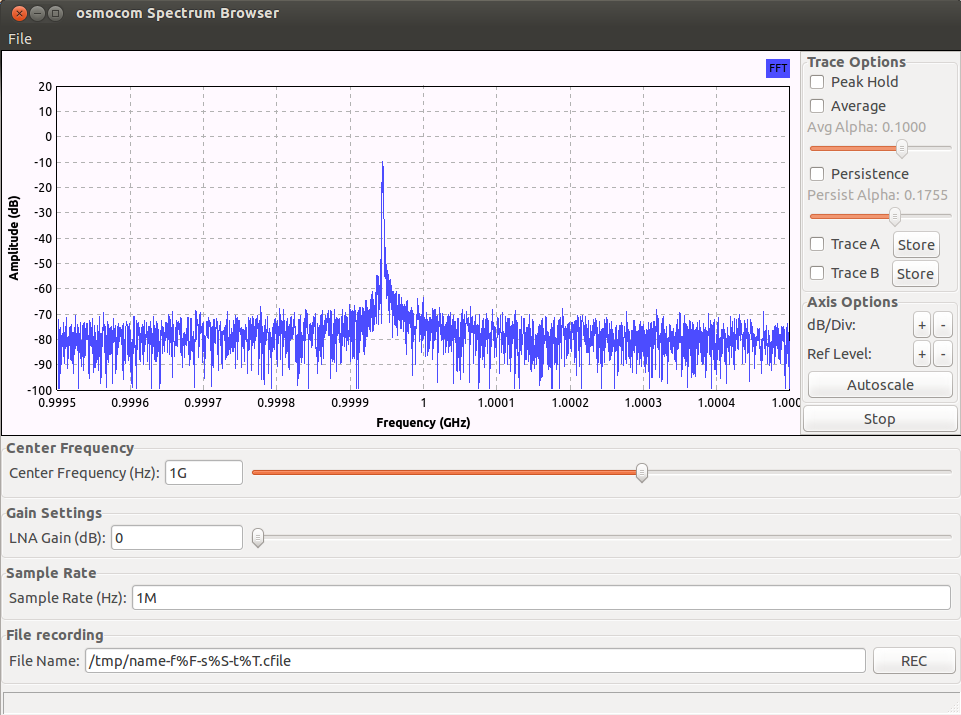
With the above artifacts in mind, let’s take a look at some typical signal spectrum. In the first picture below, I used my HP 8642B to generate a 1 GHz -20 dBm carrier signal. The spectrum is centered at 1 GHz. The frequency span and FFT size are the same as before.
|
|
The observed signal is not exactly 1 GHz, this is due to the small inaccuracies in the LO frequency. This offset can be manually adjusted in software if desired.
The picture below shows a frequency modulated (FM) signal with a bandwidth of 100kHz. The signal is modulated with a 1 kHz audio tone and again was set to -20 dBm.
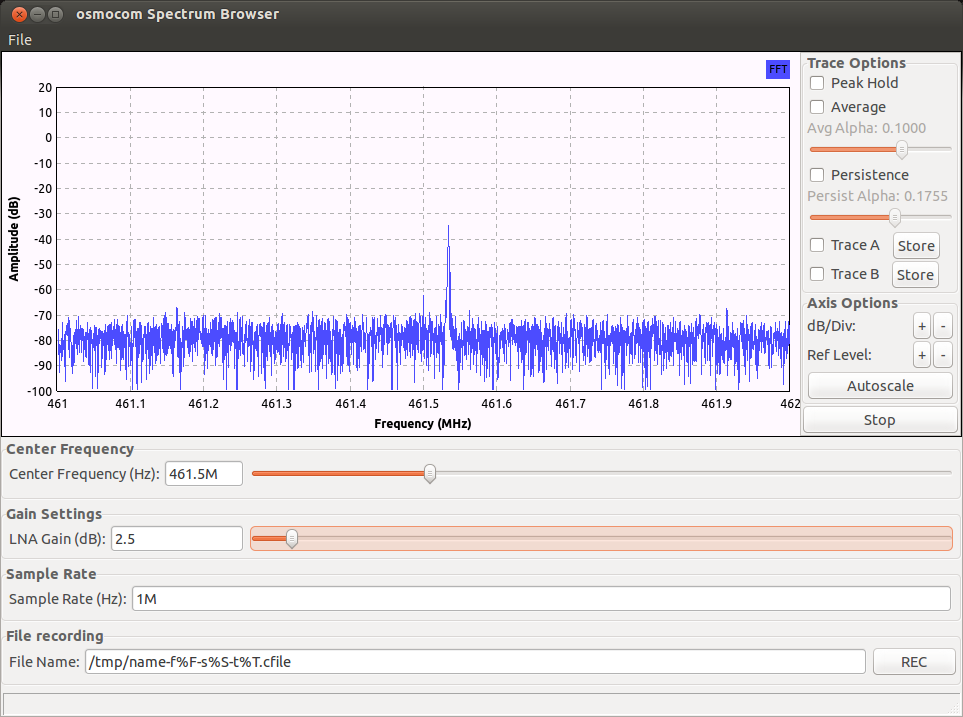
In the next picture, the spectrum is taken from the aerial reception of a Motorola walkie-talkie in transmission mode. The LNA gain was set to 2.5 dB to enhance the received signal slightly.
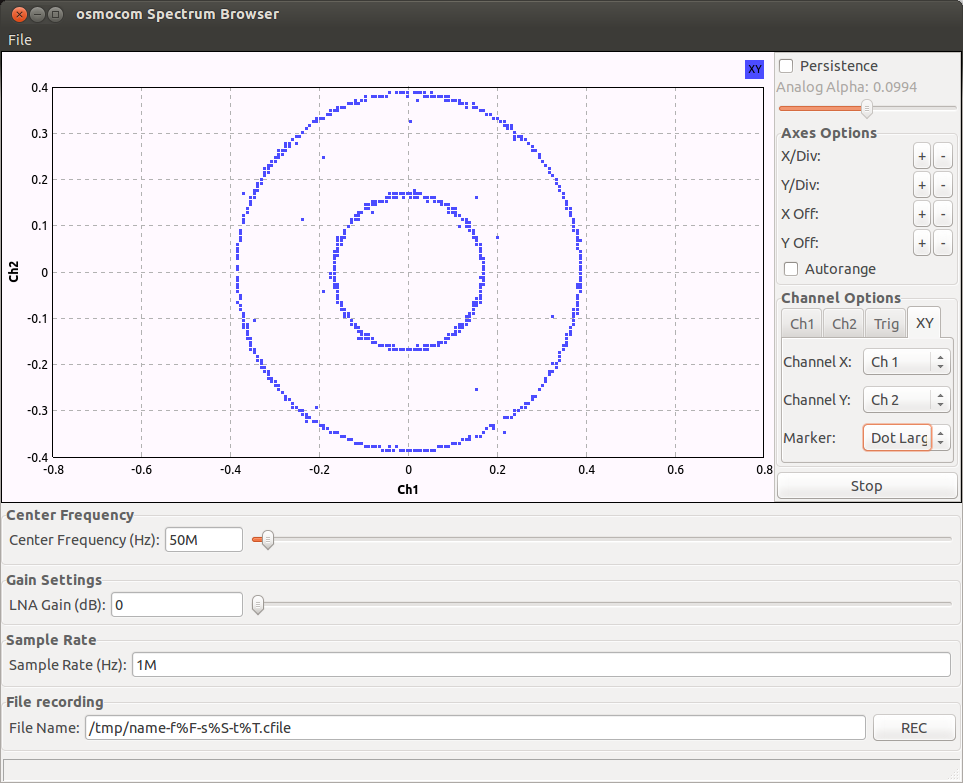
osmocom_fft can also be used to view the I/Q signals coming out from the demodulator. The picture below shows a square wave modulated AM signal (with a 50% modulation depth) at 50Mhz:
osmocom_fft -s 1M -f 50M -g 0 –fft-size=16384 –fft-rate=16 -S
One significant limitation of the RTL-SDR is that it’s real-time sampling bandwidth is limited to 3 MHz, which means if the frequency range is wider than 3 MHz multiple hops must be made in order to cover the entire spectrum. Since switching frequency band is a relatively slow operation scanning a frequency span of 30 MHz can take significant amount of time especially when the FFT size is large. This also limits the type of signal RTL-SDR can be used to observe. If the signal changes rapidly in the frequency domain, the slow response of the RTL-SDR means it will not be able to capture the signal. So RTL-SDR based spectrum analyzer is best suited for analyzing quasi-stationary signals and in situations where accurate absolute power measurement is not critical. Also, because the LNA can be overloaded easily RTL-SDR is best suited for analyzing small signals below -10 dBm. Otherwise, external attenuators will be needed.

