Last week, I discussed the construction of a network-capable temperature and humidity sensor using SHT21 and ENC28J60 with an ATmega328P microcontroller. In this post, I will show the results obtained so far and the techniques used to chart the data.
As I mentioned last time, there was some inherent limitations to the ENC28J60 library which would cause the device to hang in some situations when multiple packages are processed. A quick workaround was to recycle the power to the Ethernet controller and the main MCU once a while so that even if the controller does hang it can be brought to a well-known state after a power reset.
Also, ATmega328P is a bit under-powered for using as a general web server. So my solution was to use the microcontroller as a crude web service provider and post-process the data using a PC (in this case it is my network server). I used some shell script to pull the comma separated data from the MCU over the network and then saved the calculated data along with the time stamp into a file:
#!/bin/bash

for (( ; ; ))
do
  res=`curl -s 192.168.1.92`
  set -- "$res"

  IFS=","; declare -a AY=($*)

  if [ -z "${AY[0]}" ]; then
    continue
  else
    ts=`date '+%a %H:%M %m/%d/%Y'`
    tempF=$(echo "scale=2; ${AY[0]}/100*9/5+32" | bc)
    humidity=$(echo "scale=2; ${AY[1]}/100" | bc)
    printf "$tempF, $humidity, $ts\n"
  fi
  sleep 45
done
I then used Google Annotated Timeline to display the captured data:
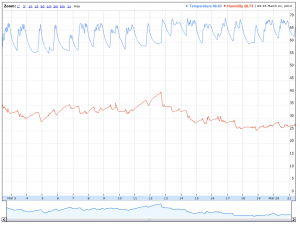
The data logger has been running for about two weeks now and you can take a look at the live data here or by clicking on the image above. Because I was sampling at a rate of roughly once per minute, the gathered data points became huge rather quickly. Unfortunately, Google Annotated Timeline does not handle large data set very well, in order for the plot to load relatively quickly I further reduced the data points by averaging every ten measurement points. If you examine the data carefully, you will also notice that the intervals are not all uniform. This is due to the fact that the network module would sometimes hang and would only come back to life after a power reset.
Oh by the way, the oscillation in the temperature readings coincides with the time I was in my basement lab and had the heat on.

