A while ago, I saw a video on the signal path in which Shahriar modified his Verity EP200Mmd monochromator/detector and turned it into a scanning monochromator. Inspired by his work, I decided to do something similar. Since I do not have the equipment to make the mechanical pieces, I decided to take another route. In this post, I will show you a simple and non-intrusive way to make the EP200Mmd a scanning monochromator. A video discussing the build and some experiments is included towards the end.
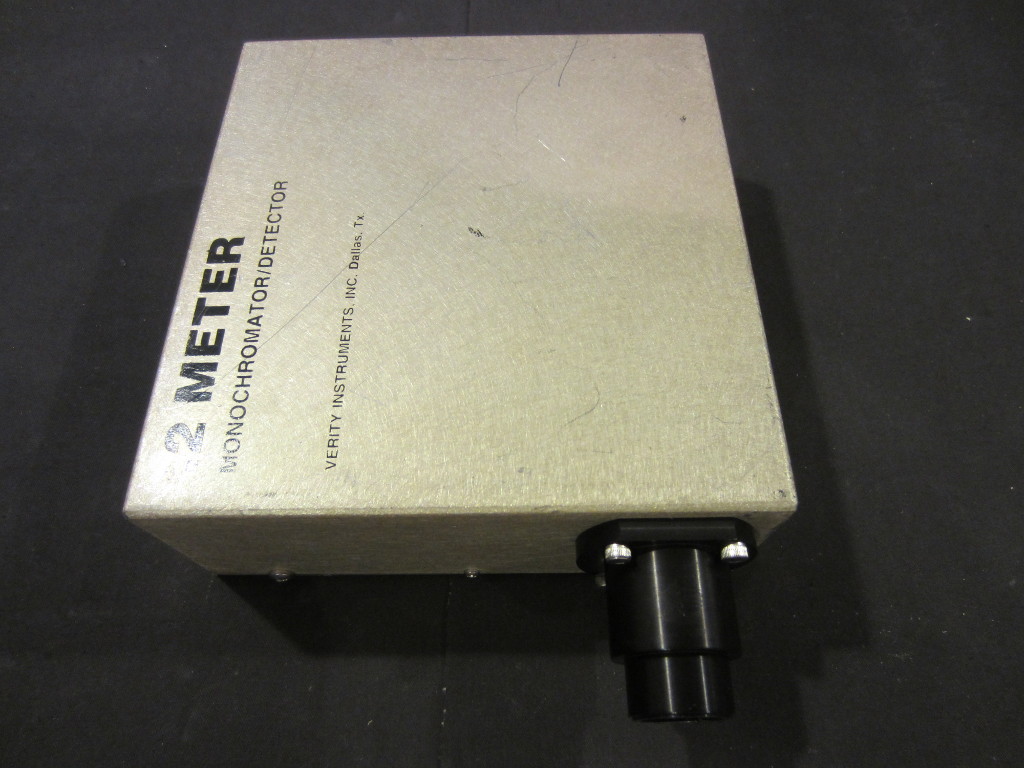
Here is a picture of my EP200Mmd. I bought it on eBay for a pretty decent price. This monochromator is slightly different than the one Shahriar had. Instead of using fiber optics to guide the light into the input slit, this one uses an input collimator/coupler to guide the light onto the input optical slit. Because of the reduced field of view, this setup is slightly less prone to stray light interference from the environment.
|
|
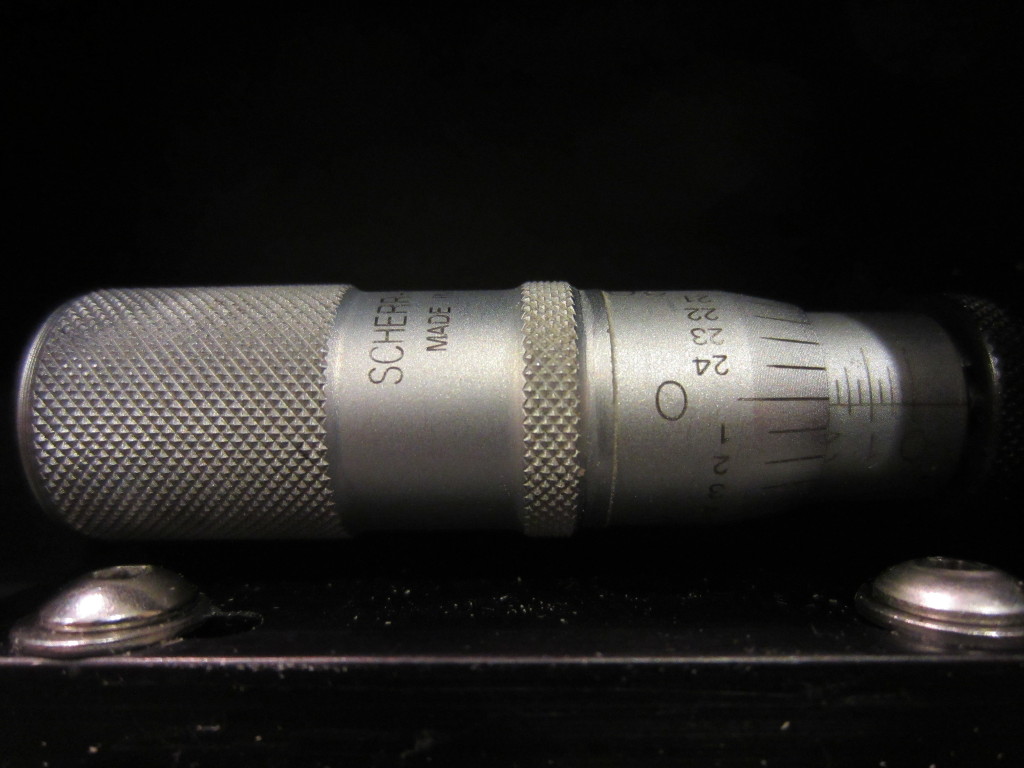
The desired wavelength can be selected using a screw micrometer. According to the specifications, the wavelength can be adjusted from 185nm to 925nm which covers most of the ultraviolet region, the visible light region (380 nm–700 nm) and all the way to the near infrared spectrum. You can see the micrometer mechanism above. In my particular unit, the upper range can only be ajusted to 903nm, but this should be sufficient for what I am doing. I might be able to re-calibrate it sometime in the future.
One thing I did notice during my initial testing of the monochromator was that the spectrum resolution was very poor, and the reason for this is that this monochromator was missing a crucial piece — the input slit. In place of the slit, there was a hole about a quarter inch in diameter, which is too big for any meaningful measurements. I am still pretty puzzled as to what happened to the slit as it did not appear that anyone had tampered with it before. Anyway, finding a proper slit for this monochromator could be quite challenging, so I decided to make one myself.
As it turned out, it was pretty easy to make a slit using a razor blade. The blades inside a razor are thin enough to be cut by scissors and can be positioned precisely. After I manipulated the pieces to get the desired opening width, I dabbed the area with tiny bit of glue so that the slit can remain be in place securely.
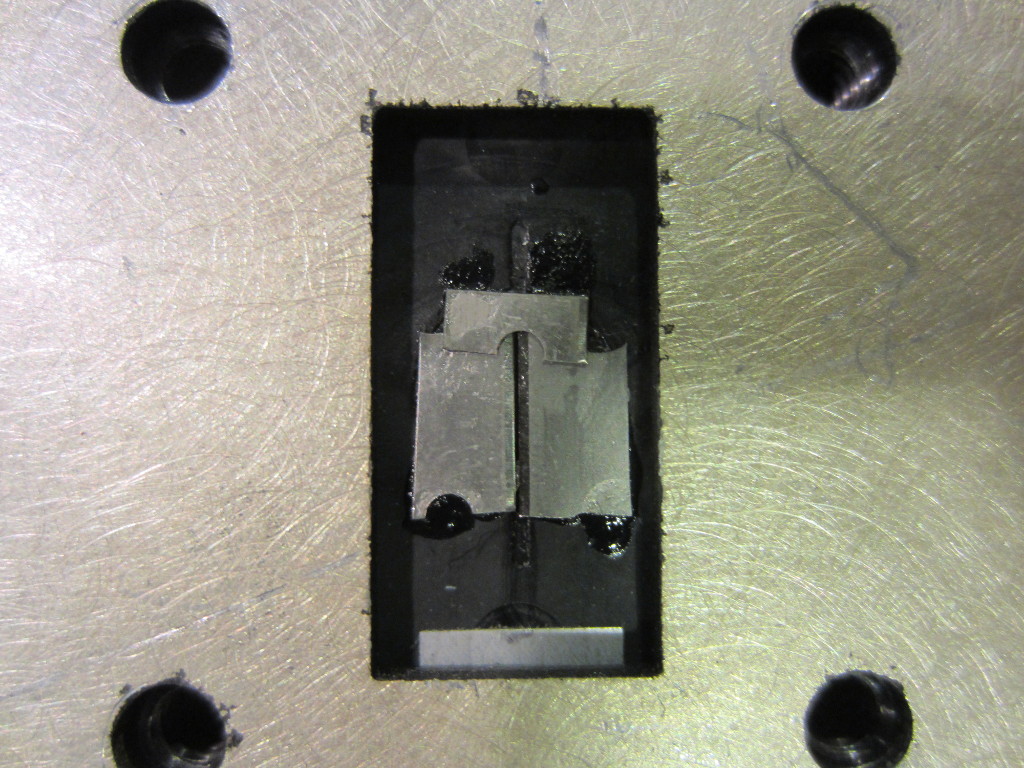
The picture below shows the makeshift slit I made. Features in this picture is magnified by roughly seven times (click on the image to see the full sized picture). The actual distance between the two horizontal mounting holes is 32 mm. So the opening of the slit is roughly 0.2 mm by estimation. According to the datasheet, this slit size should give us a resolution of 1 nm. Of course, if I do get hold of a proper slit assembly in the future I will swap this temporary one out.
Since I did not want to disassemble the monochromator like Shahriar did in his modification, I decided to use a different method to record the measurement results. The heart of the monochromator is a 1200 grooves/mm diffraction grating and it cannot be cleaned without suffering performance degradation and I didn’t want to risk damaging the delicate optics. So instead of fitting a custom shaft hub over the micrometer, which requires cutting an opening on one side of the case, I decided to use a belt to drive an optical encoder to record the micrometer readings.
The main benefit of this alternative method is that no modification to the monochromator is required. This is crucial since I do not have the equipment needed to design and build the custom mounting mechanism. Also there is always the risk of damaging the sensitive grating and other optics when opening up a precision instrument like this. Of course there are challenges to this approach as well. Because the shaft moves laterally, the belt assembly needs to be moved along when scanning through the wavelength range. Also the belt cannot exert too much force on the micrometer otherwise we run the risk of damaging it.
Given all these, I decided to drive the belt manually. In this way I can apply just enough force so that the belt does not slip and I can also adjust the horizontal alignment manually on the go. While this might sound a bit difficult to do, it is actually quite easy to accomplish in practice. You can see how this is done in my video later.
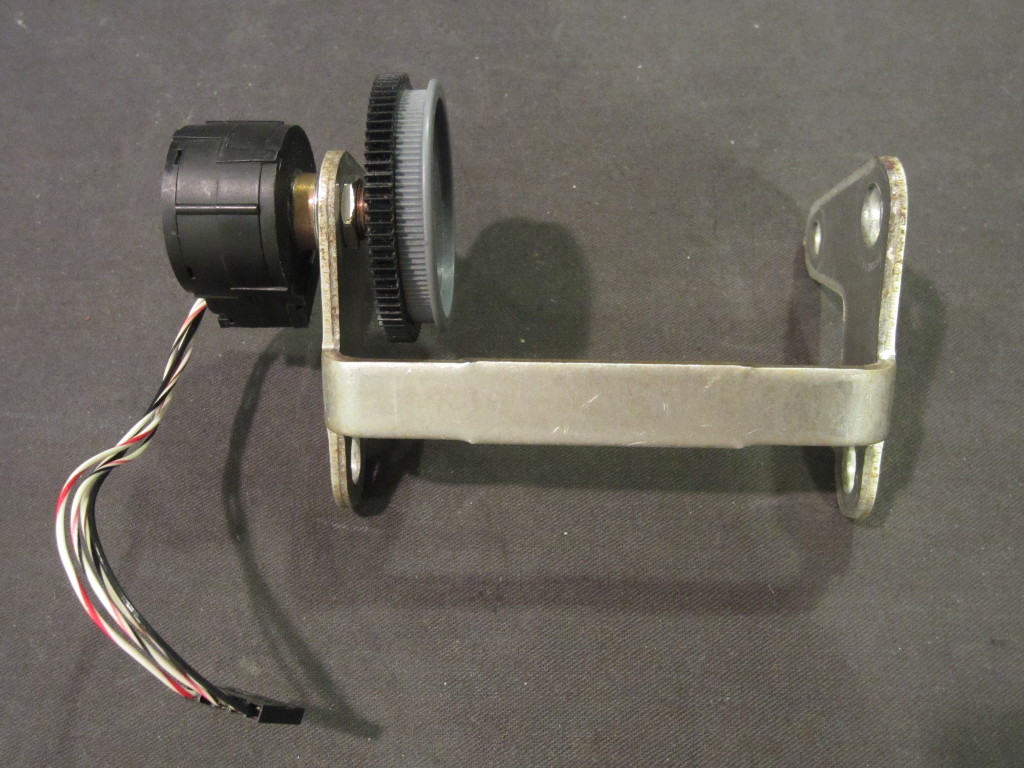
Below is a picture of the optical encoder assembly I built. The optical encoder used here was taken from an old HP equipment. The belt pulley wheel used was taken from a disassembled laser printer. The actual size of the wheel does not matter much. I glued a gear on the other side of the pulley wheel so that the belt would stay in place when rotating. Given this configuration, I get roughly 10 pulses per nanometer, which is more than adequate for the 1nm resolution we get from the slit size chosen. If you use a smaller wheel, you can achieve even higher resolutions.
The encoder readings are sent to a PC via an Arduino. Below is a picture of the simple shield I made. The 4 pin header connects to the optical encoder. Two of the encoder pins are routed to Arduino digital pin 5 and pin 6 (PWM pins) and the other two leads are for ground and Vcc respectively. I used an RCA jack to take analog signal from the monochromator detector output. Since the specified output signal from the monochromator goes from 0V to 10V but can go as high as 15V in overload situations, I included a voltage divider to divide the input voltage by three at the input in order for the analog input to stay within range.
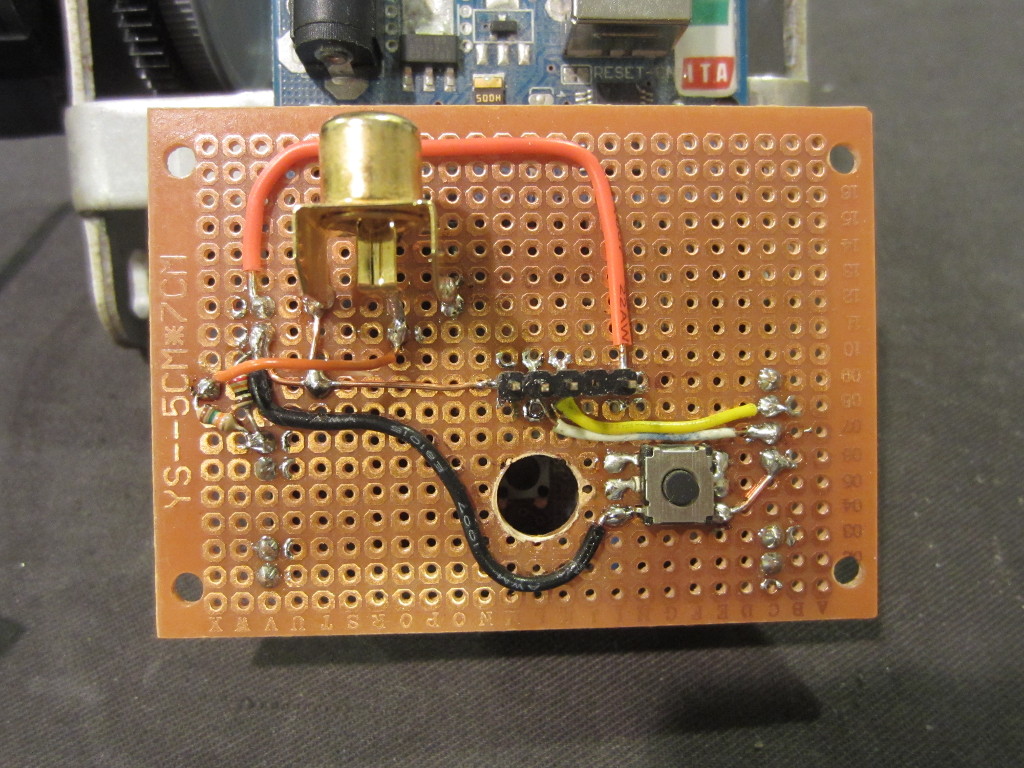
Power comes in from a modified Global Specialties 1301A power supply (±15V supply voltages and the 2-10V photomultiplier control voltage) via a DB-9 connector.
The picture below shows the typical experiment setup.
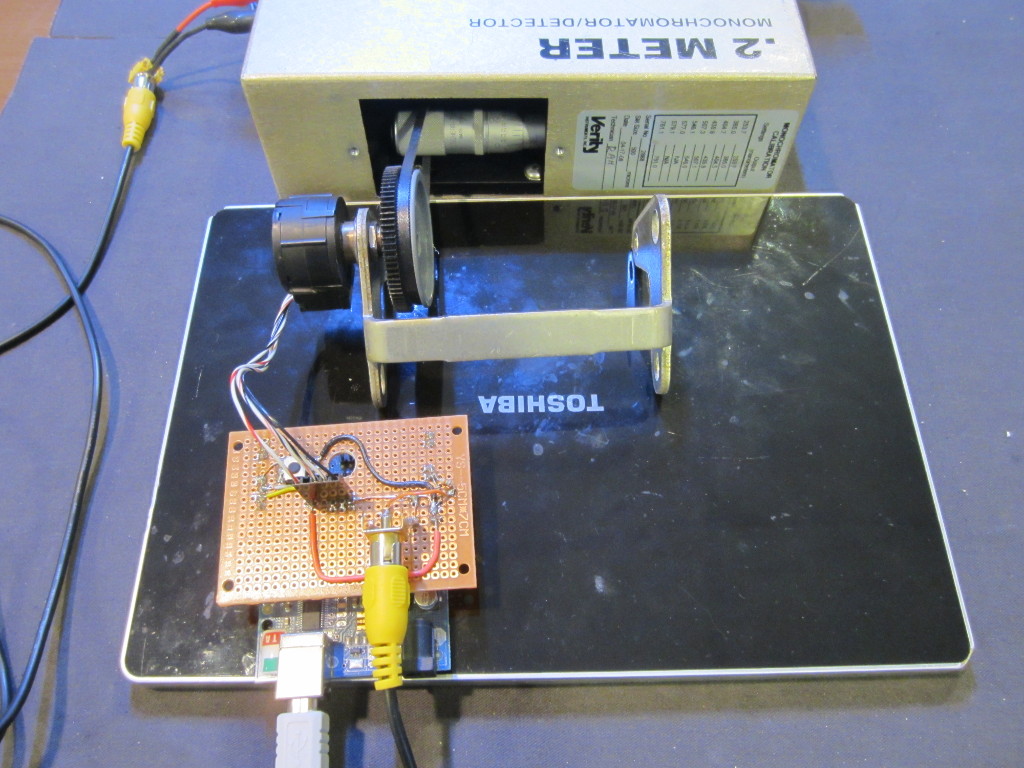
To make manual adjustment slightly easier, each run starts at 200nm and ends when the micrometer hits the upper limit (in this case 903nm). This way, we do not need to worry about the optical encoder wheel to the micrometer turn ratio as the pulses recorded would always correspond to the 703nm travel range. Each time the optical encoder value is read, we also read back the analog input voltage and this voltage alone with the encoder value is sent over via the serial port in a space separated format.
A button on the Arduino digital pin 4 is used to send a special stop signal (9999 9999) manually, so we can let the program that is listening on the serial port know that the run has stopped. You can examine the Arduino code towards the end and see how this is done. Since the encoder value is only reset to 0 inside setup(), you will need to press the reset button prior to taking measurement each time (that’s what the hole on the shield is for).
I used MATLAB to plot the received data from the serial port. You can use pretty much any programming languages to receive and plot your data however. The MATLAB code is also included towards the end.
Now, let us take a look at the spectrum of different light sources (click to see larger picutres).
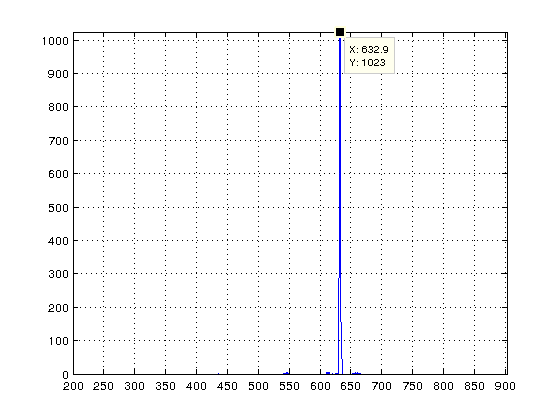
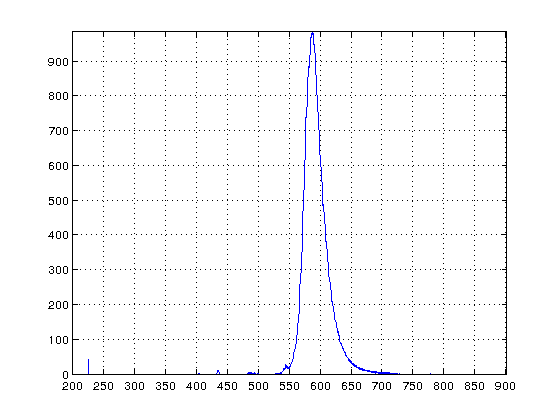
The first measurement shows the spectrum of a red Helium-neon laser. The characteristic spectrum is centered at 632.8nm. For the most accurate measurements, the monochromator must starts at 200nm precisely each time and there should be enough tension on the belt to ensure that it does not slip during the measurement.
[adsense]
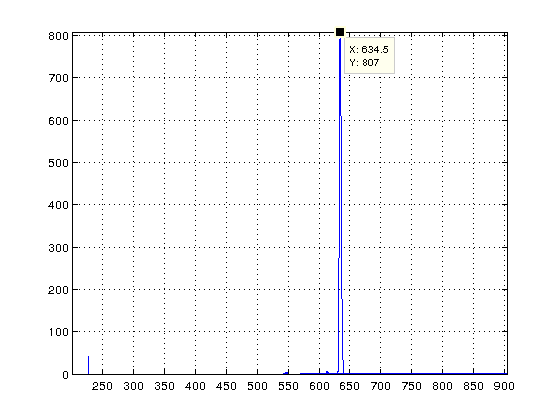
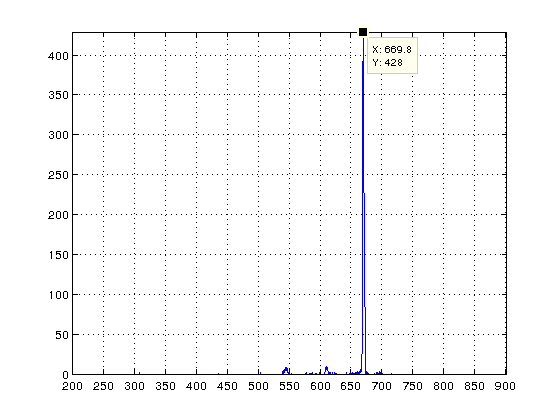
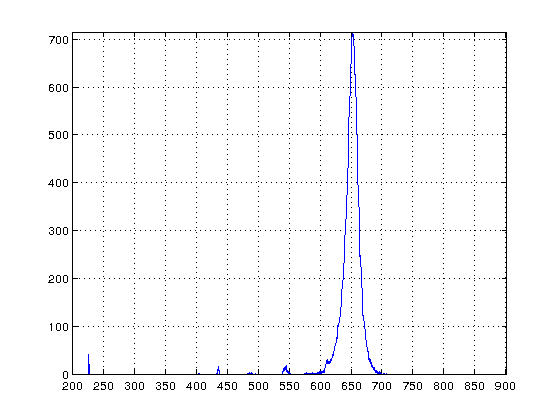
The next couple of spectrum are taken from a couple of laser diodes I have on hand. The spectrum on the left is that of a red laser diode. This is a common GaInP laser with a wavelength of 635 nm. The picture to the right shows the spectrum from an old laser pointer. I got this laser pointer more than 20 years ago. It uses an AlGaInP laser diode. The AlGaInP laser has a peak at 670 nm. Due to its longer wavelength the light appears in deeper red. Red laser pointers nowadays mostly use GaInP laser diodes as they are cheaper and much brighter than the AlGaInP ones.
|
|
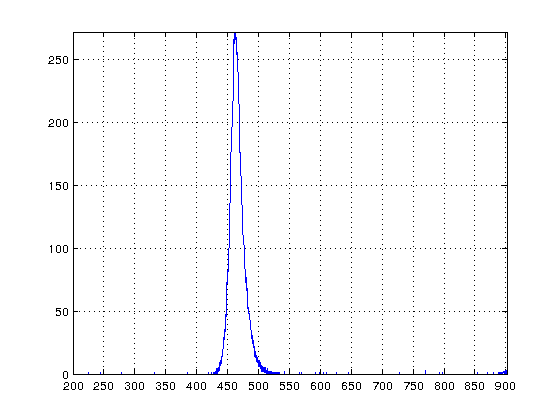
These two pictures are the spectrum of an violet LED (left) and a blue LED (right):
|
|
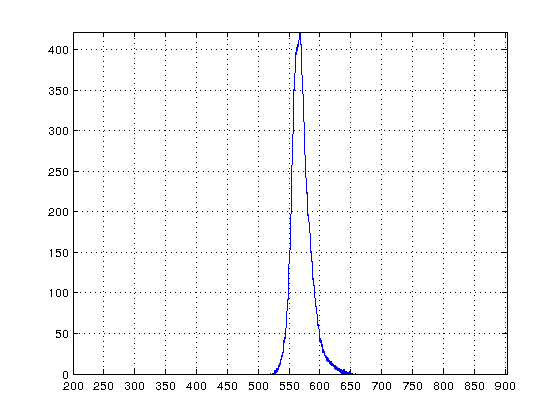
And here we have the spectrum of a green LED (left) and a yellow LED (right):
|
|
The pictures below are the spectrum of a red LED (left) and the spectrum of an infrared LED (right). Because the sensitivity at the infrared range is significantly lower for this monochromator (the ADC reading is only a tenth of the full scale), the spectrum peaks picked up from the lower wavelengths are likely from the environment and not from the infrared LED itself.
|
|
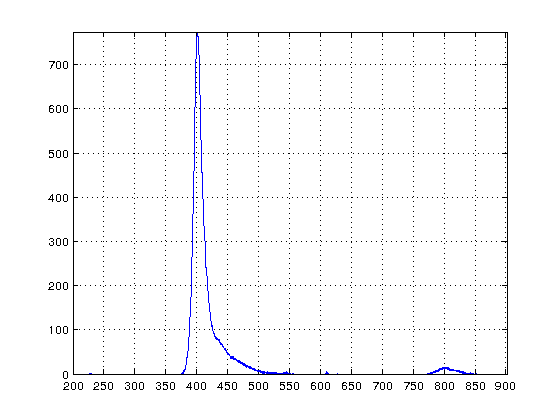
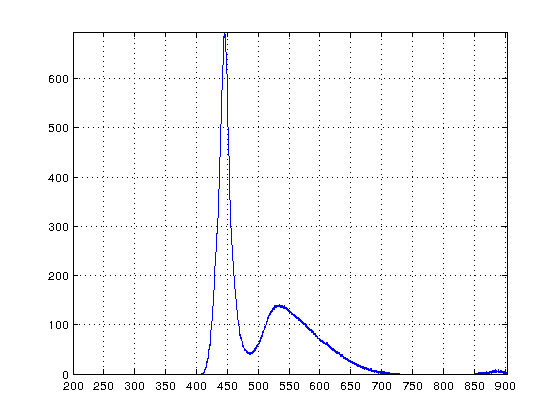
Here is the spectrum of a white LED. Since white light are essentially light from blue LED down-converted by the phosphor coating, you can see the characteristic blue LED spectrum (centered at roughly 450nm) and a much broader spectrum covering the entire visible light range from the light converted via the phosphor coating.
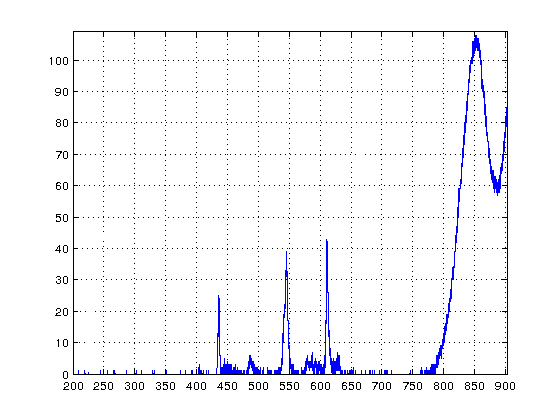
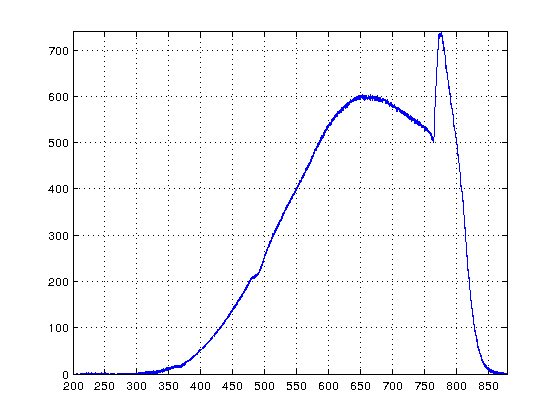
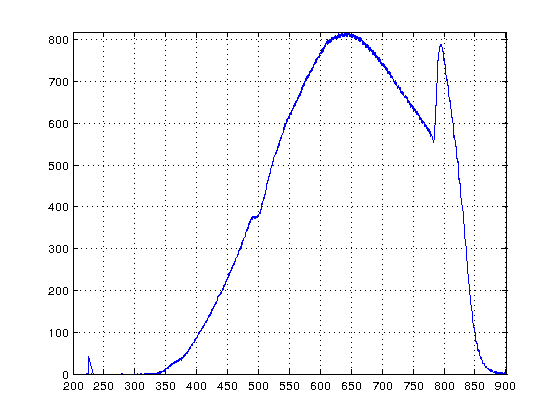
I then tested the light spectrum of two flash lights with incandescent light bulbs. The result is somewhat interesting as you can see below. Intuitively I was expecting a Gaussian shaped spectrum, but as you can see from the spectrum below, each has a peak in the 780 nm to 800 nm near infrared range.
|
|
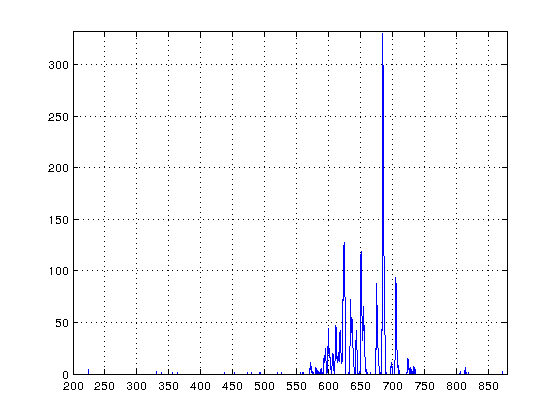
Next let’s take a look at the spectrum of a neon bulb. These gas discharge indicators were quite popular in test gears back in the 70’s (this one was from the power indicator on my HP 6113A power supply). Different spectral lines can be seen clearly.
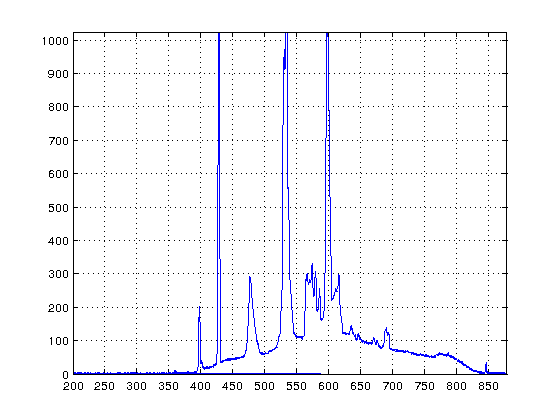
Finally, here is what the light spectrum looks in my lab. Almost all of my lights are CFL‘s and the measured spectrum is inline with the characteristics of fluorescent bulbs.
[adsense]
Arduino Code
#include <Encoder.h>
#include <SPI.h>

#define STOP_BTN_PIN 4
#define ENC_PIN_1 5
#define ENC_PIN_2 6

long data[2];
int adcOut;

int buttonState;
int lastButtonState = LOW;

Encoder enc(ENC_PIN_1, ENC_PIN_2);

long oldPos = -9999;
long newPos;

void setup()
{
    pinMode(STOP_BTN_PIN, INPUT);
    digitalWrite(STOP_BTN_PIN, HIGH);

    Serial.begin(115200);
}

void loop()
{
    newPos = enc.read();
    adcOut = analogRead(A0);

    data[0] = newPos;
    data[1] = adcOut;

    if (newPos != oldPos) {
        oldPos = newPos;
        Serial.print(newPos);
        Serial.print(" ");
        Serial.println(adcOut);
    }

    if (digitalRead(STOP_BTN_PIN) == LOW)
    {
        Serial.println("9999 9999");
    }
}
MATLAB Code
startWL = 200;
stopWL = 903;

delete(instrfindall)
serialPort = serial('/dev/ttyUSB0', 'BaudRate', 115200);
serialPort.TimeOut = 60;

fopen(serialPort);

while 1
    out = fscanf(serialPort)

    if strcmp(strtrim(out),'9999 9999')
        break
    end

    [x y] = strread(out)

    if x >= 0
        w(x + 1) = x;
        v(x + 1) = y;
    end
end

w = w./length(w)* (stopWL - startWL) + startWL;

plot(w,v);

axis([min(w) max(w) 0 max(v) + 1]);
grid on;
shg;
set(gca, 'xtick',[200:50:903]);

fclose(serialPort);
delete(serialPort);
clear serialPort;

