In a previous post, I did a teardown of a NanoVNA-F V2. This time let’s take a look at a LiteVNA vector network analyzer. One of the key differences between the LiteVNA and the NanoVNA-F V2 is that LiteVNA has a frequency range from 50 kHz all the way to 6.3 GHz which essentially doubled the frequency range of the NanoVNA-F V2.
LiteVNA current has two versions: LiteVNA 62 and LiteVNA 64. Besides LCD screen sizes (2.8 inch for the 62 model versus 3.95 inch for the 64 model) and battery capacities (1.3 Ah for the 62 model versus 2 Ah for the 64 model), all other technical aspects are identical. The model I got here is the LiteVNA 62.
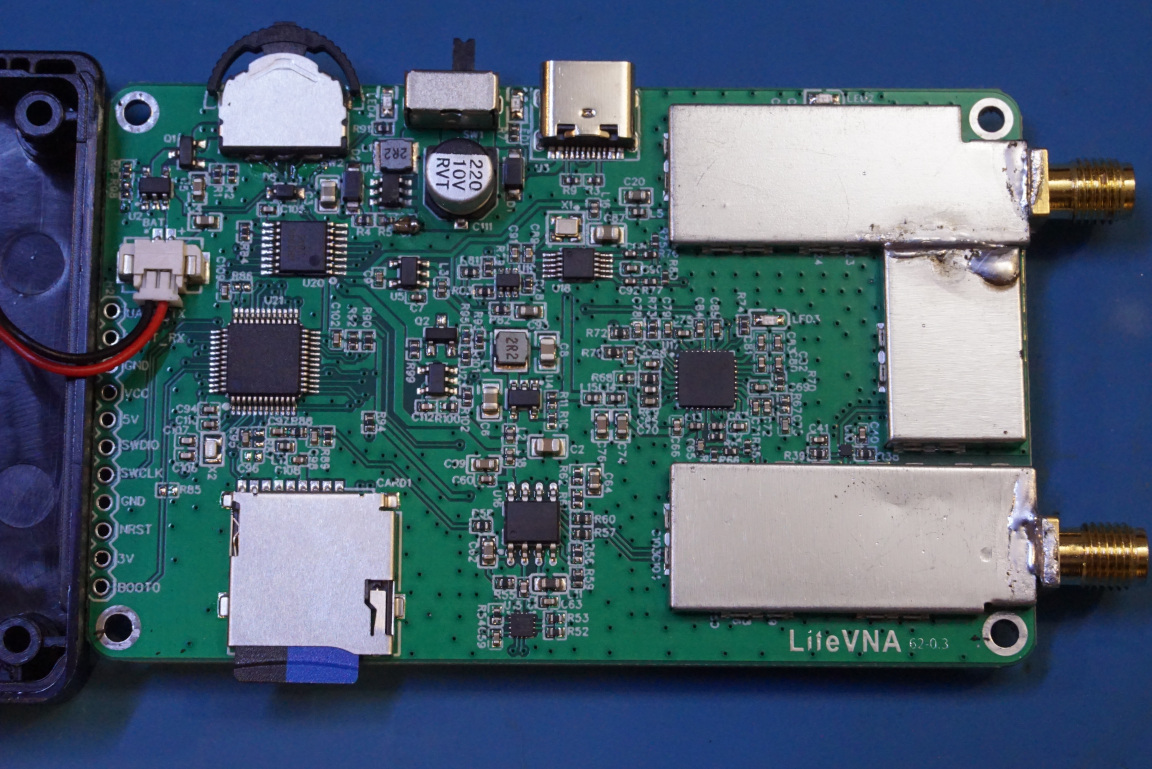
Unlike the NanoVNA-F V2 which is enclosed in a metal case, the LiteVNA comes in a plastic case with no additional shielding. But the build quality looks quite decent.
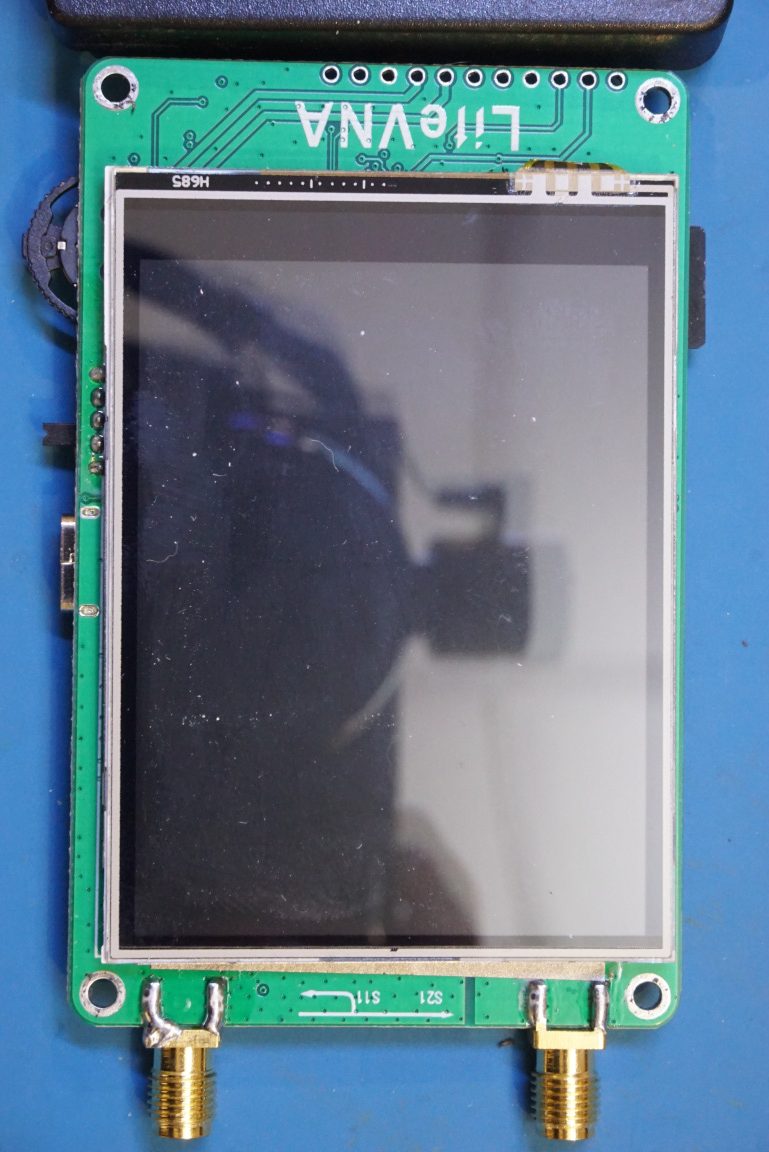
As can be seen in the picture to the left below, the touch screen included uses 4 wire resistive sensing. Also note that all the header connections had been routed to the edge of the board. This design makes it easy to debug/troubleshoot. The inclusion of a microSD slot is certainly a welcome feature as it can be used to store screenshots during measurements.
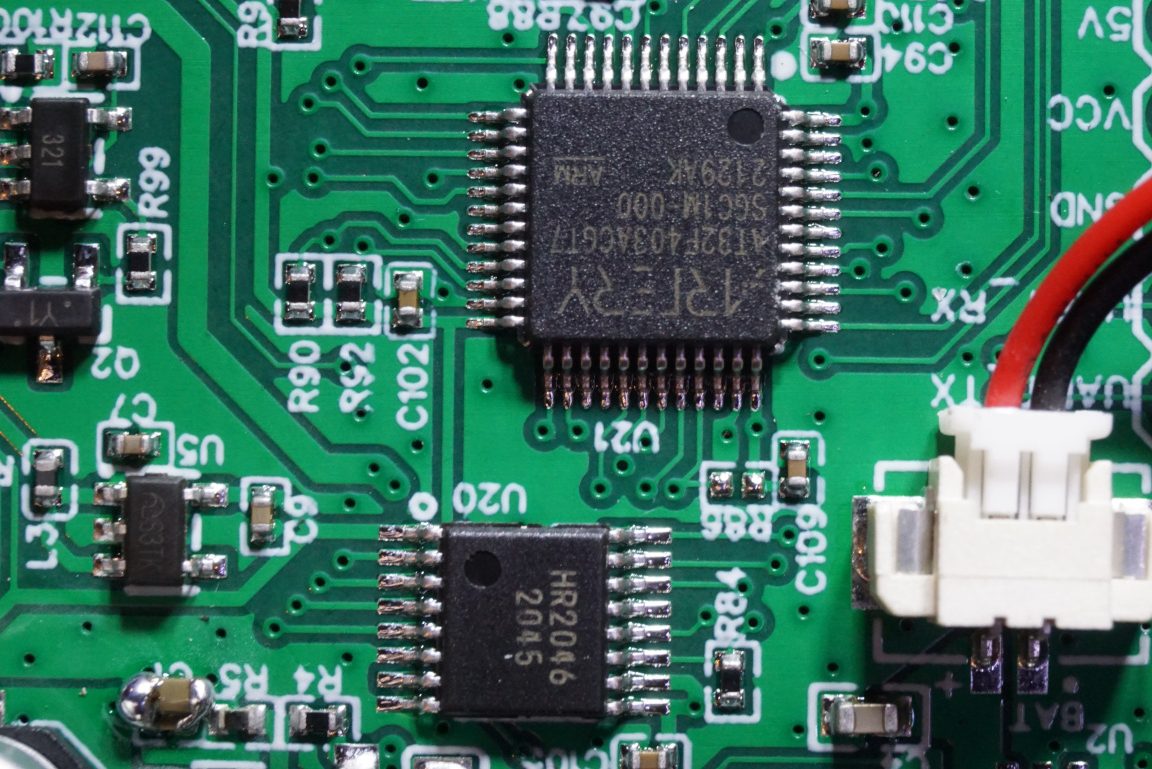
Below, you can see the touch screen controller HR2046. This chip is compatible to TI’s TSC2046. The MCU used is a AT32F403 ARM Cortex M4F by ArteryTek.
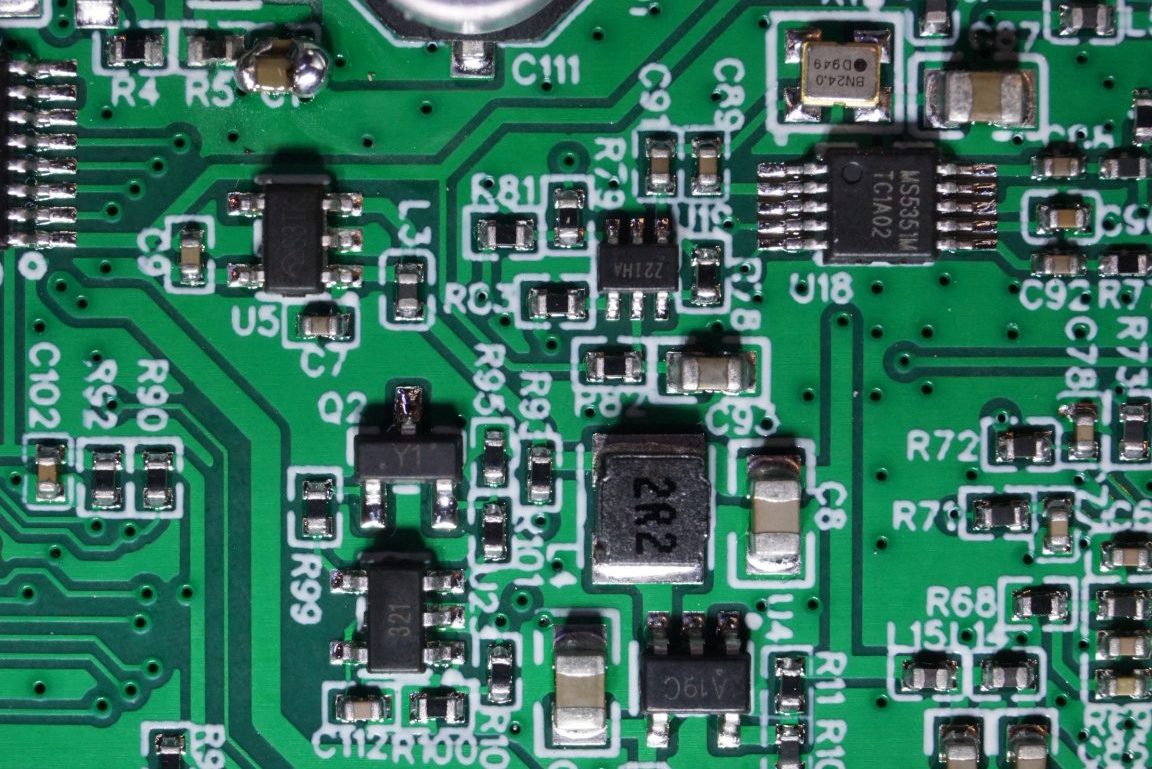
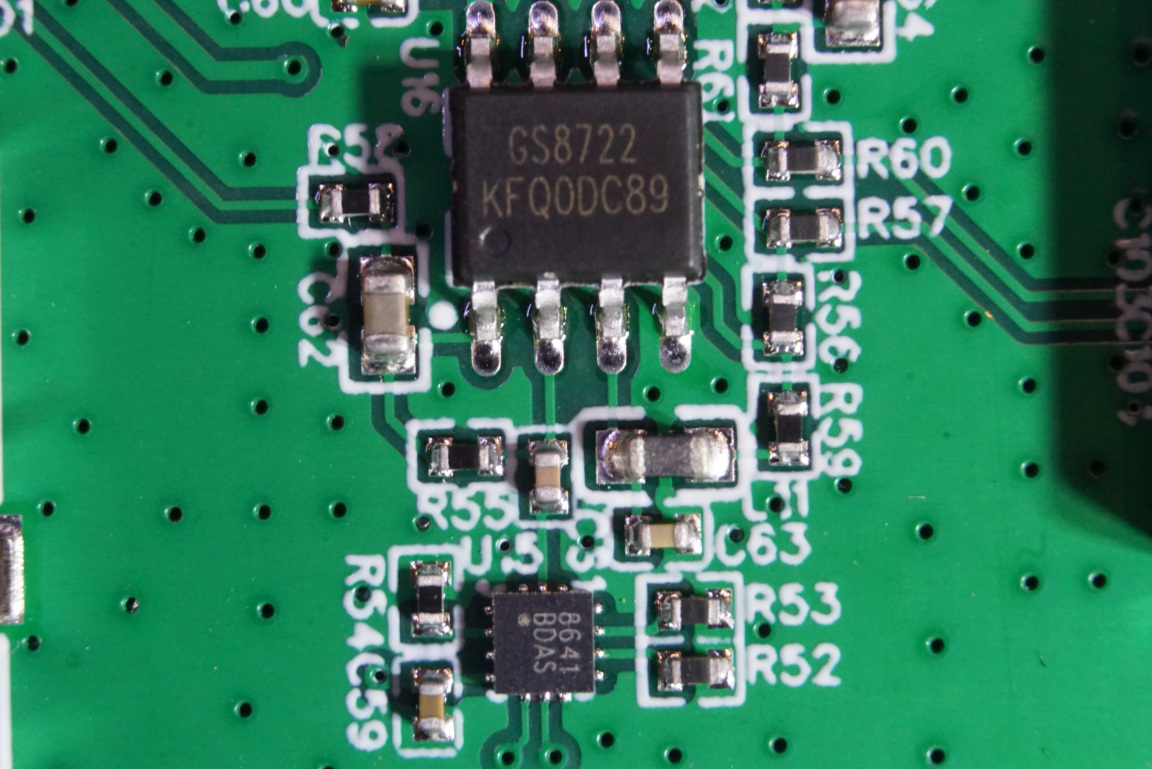
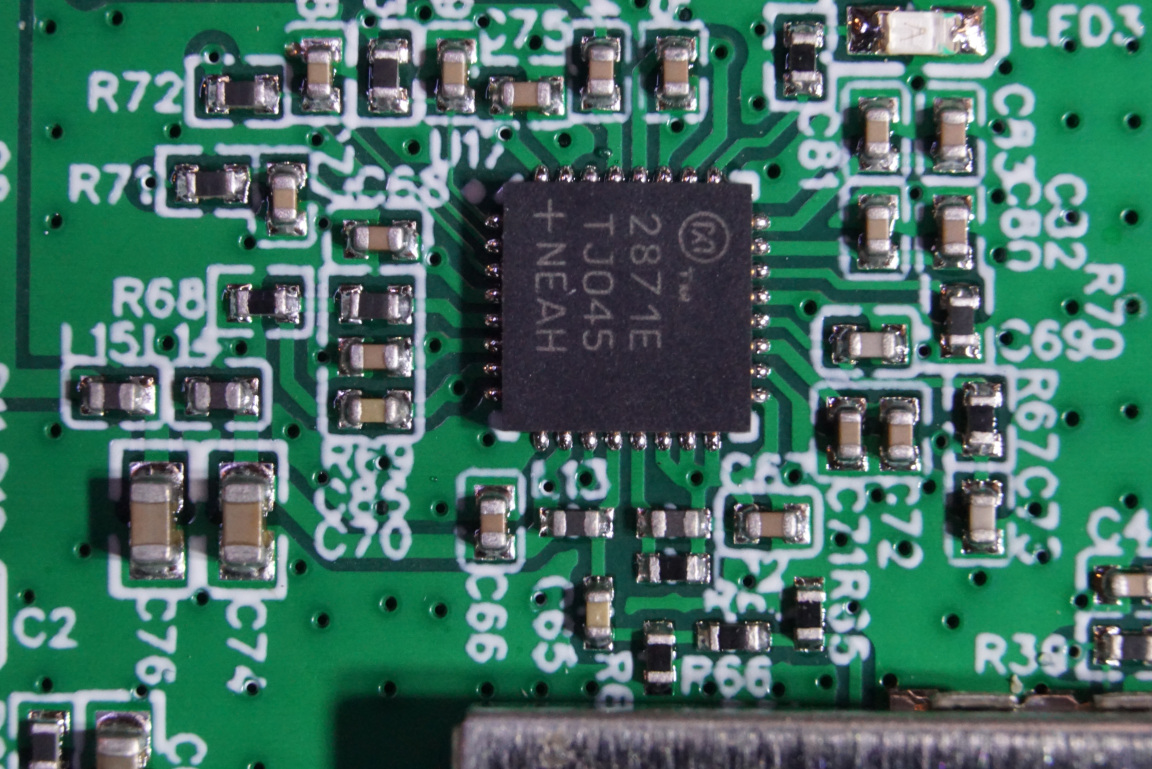
In the picture to the left below, you can see an MS5351M I2C CMOS clock generator chip. The same chip is also used in the NanoVNA-F V2. In the picture to the right below there is a GS8722 rail-to-rail opamp and below the opamp there is an 8641 RF switch (SP4T) for switching the signal paths. This arrangement is again very similar to that in the NanoVNA-F V2. I suspect there are more of these 8641 RF switches on the board, but I did not remove any of the shielding cans to verify as they are soldered on.
Between the two shielding cans for S11 and S21 ports, there is a 2871E. It is a 23.5 MHz to 6 GHz fractional integer-N synthesizer and VCO.
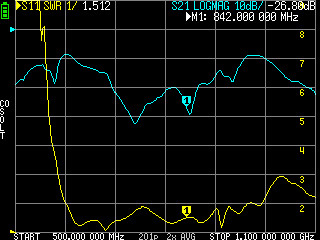
Using the LiteVNA, I measured the 600 MHz to 6 GHz cross-polarized 4×4 panel antenna I reviewed last time. In addition to measuring using the LiteVNA as standalone, I also hooked it up to the computer and used NanoVNA saver to measure the same range. The results are shown below.
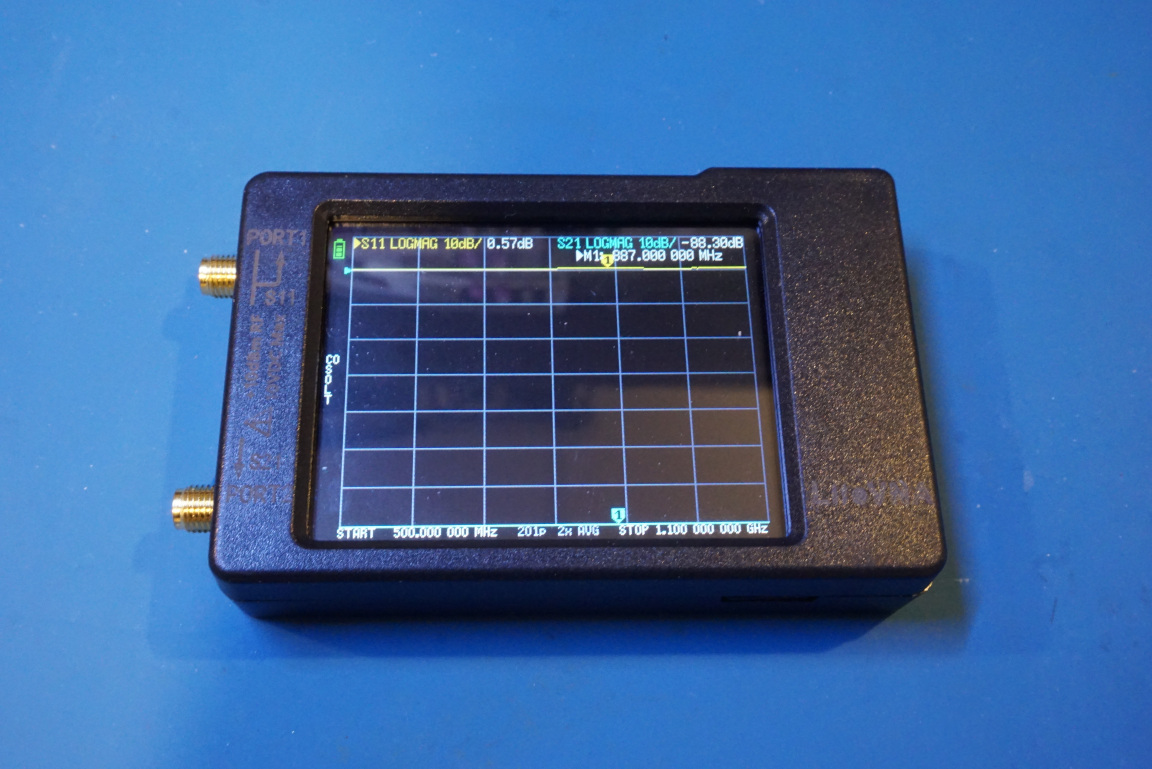
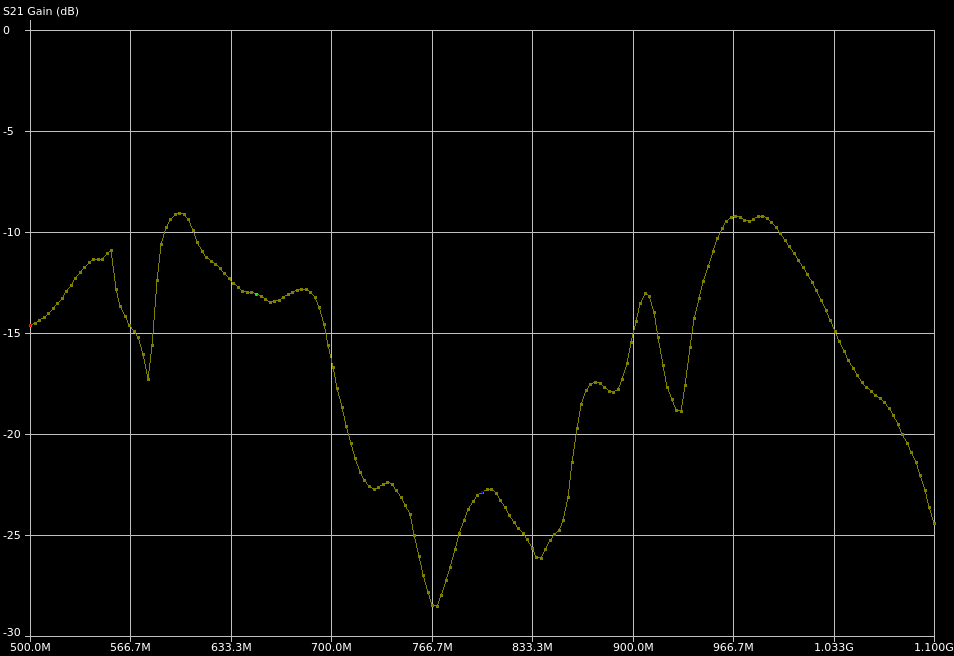
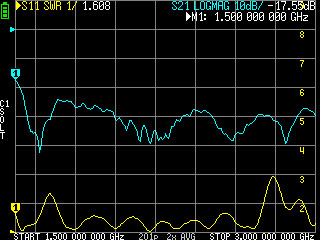
The first set of measurements are done between 500 MHz and 1.1 GHz. The antenna’s specified frequency range for the lower band is between 600 MHz to 960 MHz. The yellow trance from the LiteVNA screen capture is the VSWR and the cyan trace is the cross channel coupling (S21) measurement.
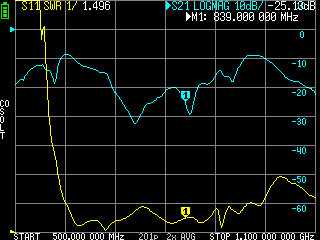
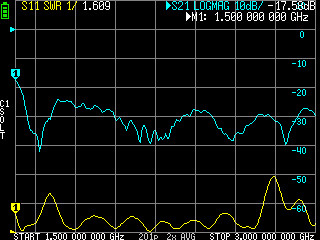
Here are the same measurement done in conjunction with the NanoVNA saver program. The trace on the left is the VSWR measurement and the trace on the right is the S21 which measures the coupling between the two adjacent antenna elements. As expected, the results obtained are pretty much identical to those shown above.
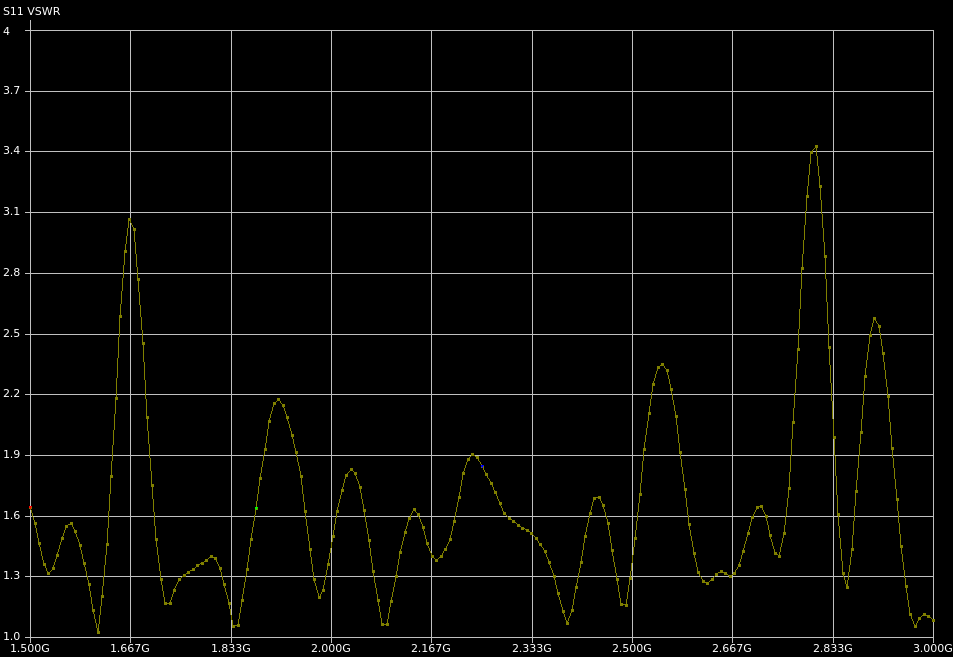
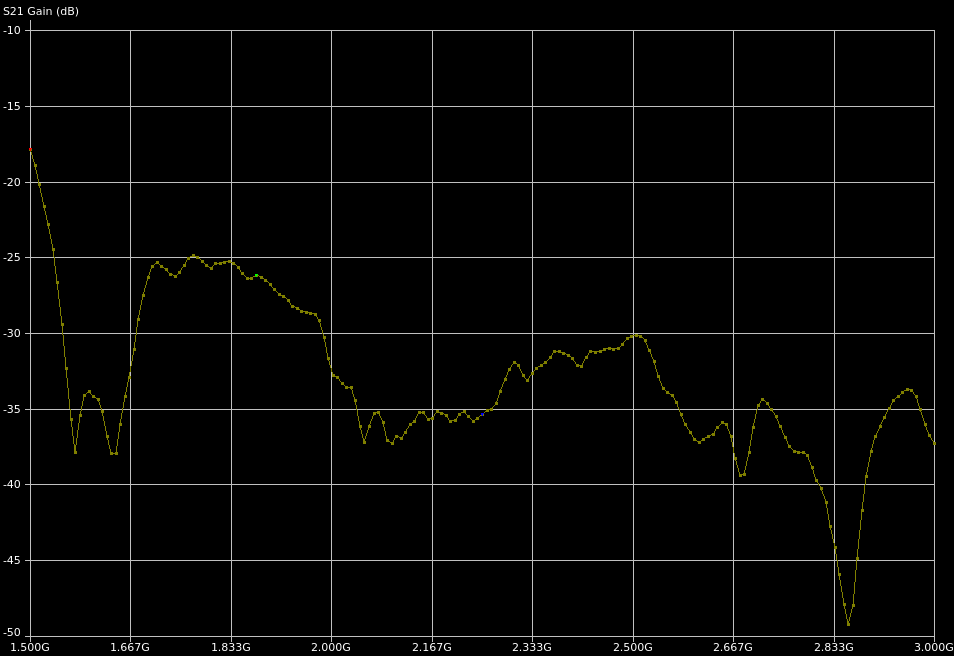
Here we are sweeping between 1.5 GHz to 3 GHz and measuring the mid-band of the antenna (specified between 1.71 GHz to 2.7 GHz).
Again, you can see that the results obtained either by the LiteVNA or using the NanoVNA saver software are similar. There are some minute differences however and it is likely due to the placement of the antenna during each measurement as the measurement is sensitive to many environmental factors.
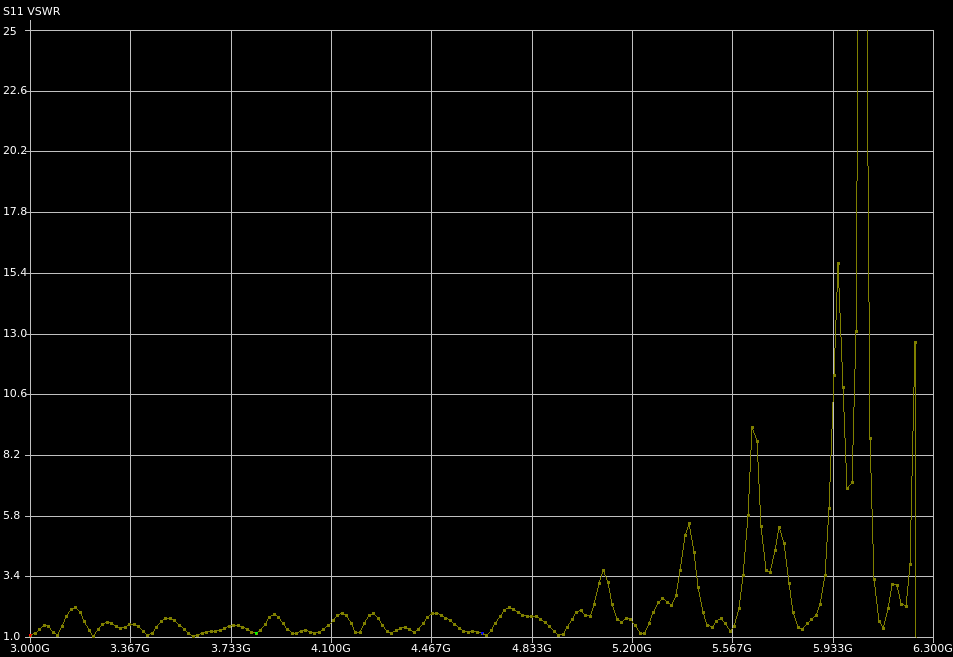
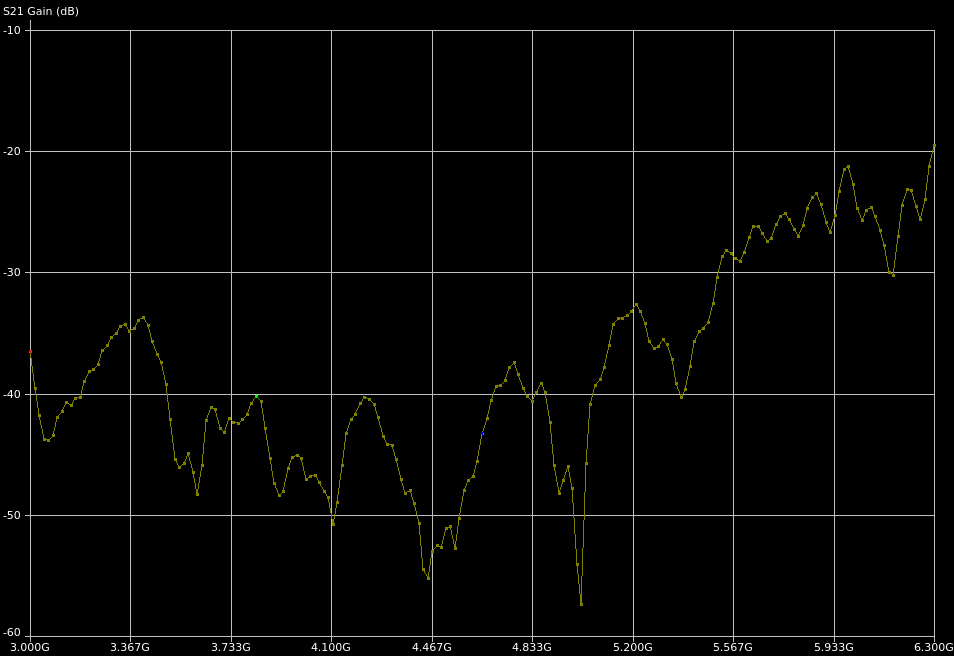
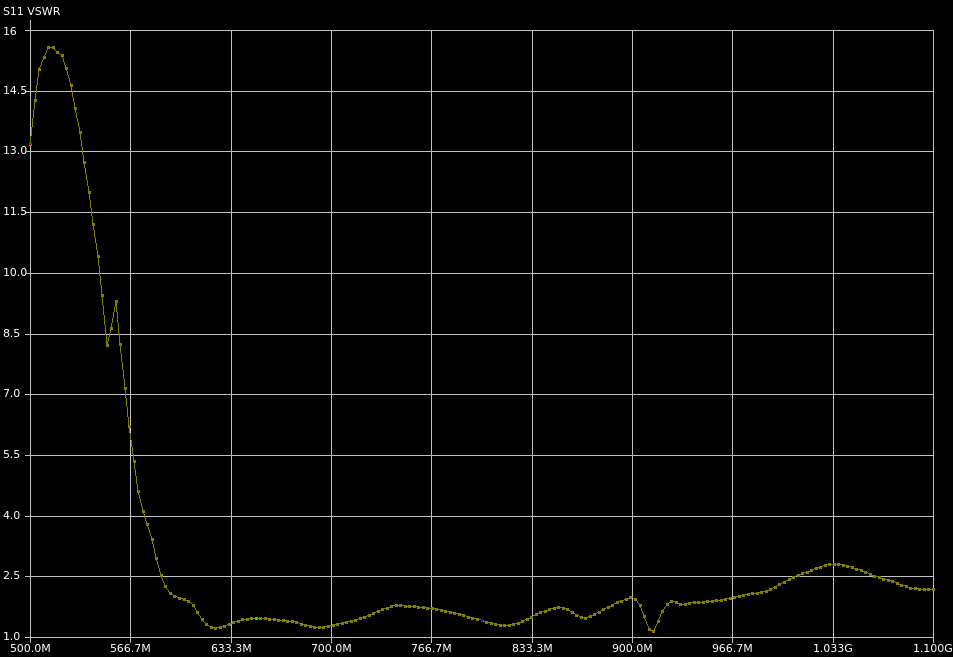
The last set of measurements are done between 3 GHz and 6.3 GHz. The higher band of the antenna is specified as between 3.3 GHz and 6 GHz.
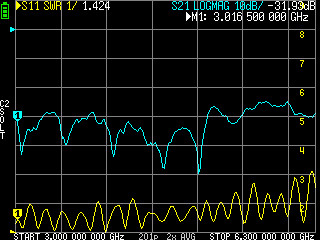
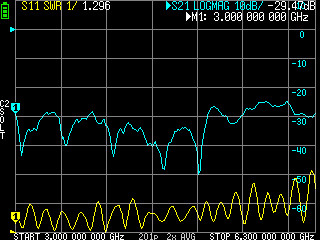
This time the NanoVNA saver measurements showed quite a bit of deviation from what we obtained from the LiteVNA alone. This is especially prominent in the VSWR measurement. The VSWR measurement recorded by NanoVNA saver is significantly higher than that measured by LiteVNA as standalone. I am not entirely sure why this is the case but I suspect when connected to the PC, the additional noise coupled via the USB cable could have contributed to the performance degradation. This is definitely something you should consider when measuring higher frequencies towards the upper limit of the LiteVNA.